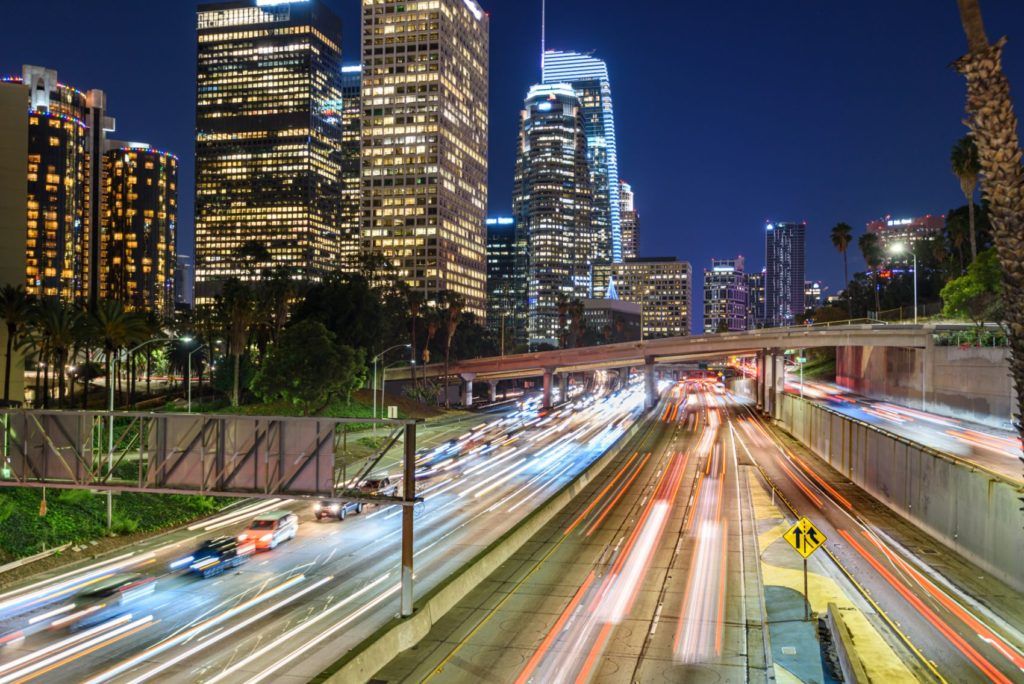
As states begin to relax COVID-19 restrictions, expect a sudden rise in traffic levels. According to a new study from Agero, daily traffic levels are rebounding and climbing to pre-COVID-19 figures. Agero, a driver assistance and roadside services company, looked at data on vehicle breakdowns as the basis for their study. After analyzing this data, Agero found that daily breakdown averages are growing at a weekly rate over four times faster than the same period in 2019.
“The pandemic has certainly disrupted traditional traffic patterns,” explained Beth Davidson, Agero’s Chief Marketing Officer. “But as states continue to ease stay-at-home orders, we’re seeing breakdown event volumes rapidly return to near-normal levels as people begin to use their vehicles again.”
Agero notes the average daily number of roadside events decreased by 32 percent between the first two and a half weeks of March and from March 17th to Easter Sunday (April 12th). Since then, average daily breakdown events have shown a greater than 30 percent increase through June 10th.
“We believe this could be the start of far higher traffic volumes than we are used to seeing,” Davidson said.
How Traffic Levels Changed Across The U.S.
The Institute of Transportation Engineers maintains an ongoing archive of how COVID-19 has impacted traffic levels across the United States. For example, Fort Collins, Colorado, saw travel reductions between 45 and 55 percent, while traffic in Overland Park, Kansas, was anywhere from 50 to 60 percent below normal between March 25th and April 19th. Likewise, Sioux Falls, South Dakota, the state’s largest city, saw a decline in daily commuters.
Meanwhile, in Wisconsin, officials say traffic levels decreased by more than 40 percent from roughly 2.5 million vehicles on Tuesday, March 3rd, to 1.5 million on Tuesday, April 7th. New Hampshire has reported an increase in turnpike traffic, but state officials say the numbers are still well below pre-pandemic levels. In general, Detroit, San Francisco, and Seattle saw the most substantial declines in traffic with the onset of the COVID-19 pandemic.

Traffic Levels On The Uptick
Agero’s study determined, based on breakdown data, that traffic levels between the week of April 12th and the first week of June increased an average of four percent each week. By contrast, last year’s typical beginning-of-summer seasonal uptick showed average volume growing by under one percent weekly.
One possible explanation for the increase is how some Americans began to feel stir-crazy in quarantine. After extended lockdowns, many citizens are ready to return to some sense of normalcy (however, there is no clear consensus on when “normal” will arrive according to a recent Gallup poll). That said, some may find joy in driving and being outdoors again, especially now that the summer months are here.
“We are seeing this in the Detroit metro right now,” said Carl Anthony, Managing Editor of AutoVision News. “Every Saturday night for the last month, locals have packed Woodward Avenue to cruise, show off their cars, and meet up with friends. While it’s generally always busy on Saturday nights, especially through the Royal Oak and Birmingham areas, people are really showing up this year after the lockdowns in Michigan.”
The latest re-emergence maps from INRIX show that trips to parks in Seattle are seeing a 24 percent increase week to week. Similarly, visits to medical facilities and restaurants are seeing an increase according to the re-emergence maps.

Public Versus Personal Transportation
The unknowns of utilizing public transportation may also account for the rise in traffic levels. Although restrictions are easing, social distancing guidelines are still recommended to prevent the current spread of COVID-19 and reduce the likelihood of a second wave. Mass transit mainstays, like buses, rail, and even planes, may have a harder time providing Americans the same peace of mind as a traditional vehicle. A recent whitepaper from Minnesota’s VSI Labs notes that public transportation is down 75 percent compared to normal.
“Personal transportation is going to get a boost because that is the only way people are going to feel safe moving around in the era of COVID-19,” explained Rudy Burger, Managing Partner, Woodside Capital Partners during the May edition of AutoSensONLINE. “I don’t think anybody is in a big hurry to jump into a crowded public transportation system; the question is what will replace that, and personal transportation is the answer.”
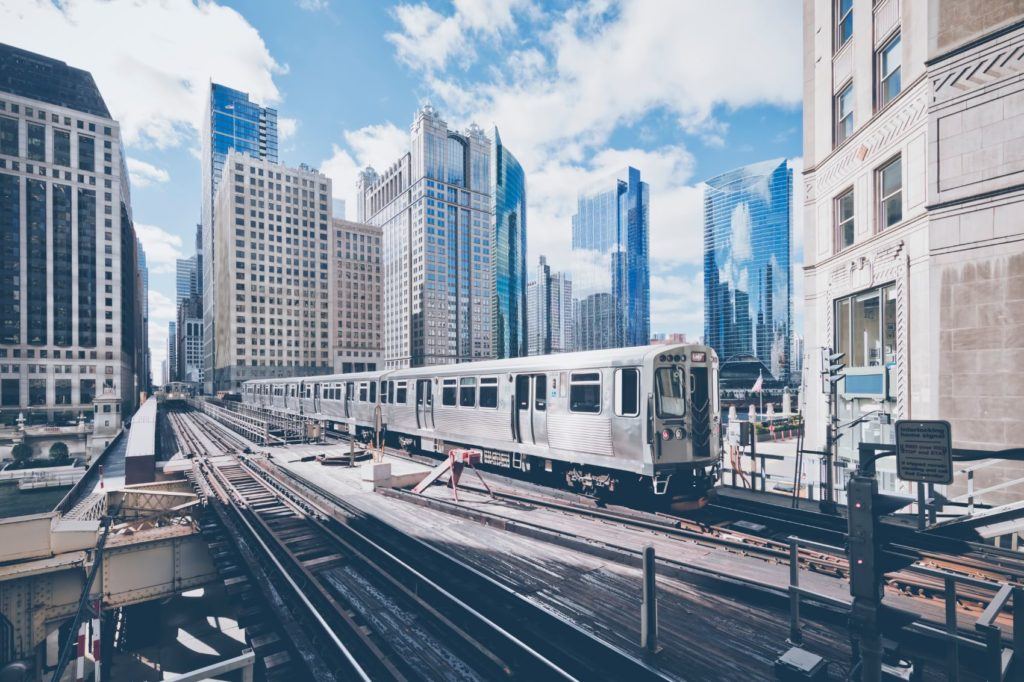
The Chicago Tribune reports that CTA ridership has dropped amid the COVID-19 pandemic. Washington D.C. and New York City have seen similar drops as well in public transportation. Some experts surmise it might take a year or more before we can fully resume some everyday activities, like taking the subway or riding the bus.
“There’s going to be a large number of consumers who will prioritize that personal, private space of their vehicle as opposed to moving around on public transportation,” said Tim Dawkins, Lead, Automotive & Autonomous Mobility at The World Economic Forum. “And I think the automakers will be happy to capitalize on that in the immediate term.”

The New Normal Might be a Better One
In a blog post from TomTom, George de Boer (Global Director, Marketing, TomTom Automotive) suggests we may see a change from the typically congested roads we are accustomed to driving. He observes that, as we work from home, it allows doctors, nurses, and other essential workers more freedom to commute. And when we do need to travel, new car companion apps can help us determine the more efficient times to depart.
“If we implement these changes, traffic would be distributed more evenly, creating less congestion on the roads,” de Boer writes. “It would not only save people time and cost, but it would also be cleaner for the environment as driving a car at a constant speed creates less pollution than a car being trapped in traffic jams.”
“Congestion costs Americans billions of dollars each year. However, it appears to be stabilizing in some of the country’s most congested metros – with delays raising roughly three percent nationwide since 2017,” said Trevor Reed, transportation analyst at INRIX. “The continued innovation and investment in smarter roadway management is showing early signs of progress.”
In March, INRIX published its 2019 Global Traffic Scorecard that identified and ranked congestion and mobility trends in more than 900 cities, across 43 countries. According to the report, Americans lost 99 hours a year due to congestion, costing them nearly $88 billion in 2019, an average of $1,377 per year.
“Hopefully, there will be a silver lining from the Coronavirus that draws our attention much more on cleaner living and reduced congestion in our living spaces,” de Boer added.


